跟着 mimic-code 探索 MIMIC 数据之 notebooks CRRT (三)
文章目录
感觉必应随便搞个图下来当封面不错的。再来一次

这一篇为什么隔了好几天才出来呢,因为代码的理解难度突然、陡然、猝不及防的上了个 90 度的坡。我看了好几天没看懂。在 RStudio 里光是调代码缩进方便看代码眼睛都要瞎了。结果我的 1080p 屏幕还是无法很好的显示代码,因为一段代码太长了。最后实在没办法还是用 vim 调,顺便学了下 vim 里代码折叠,然后就可以愉快的把那种括号内的东西折叠起来,然后再调代码缩进方便很多,然后代码格式调好了,但是我不是很懂 …… 还得看。
通过前面的两篇,我们用尽心思,千辛万苦,翻雪山过草地,四渡赤水河,用了七七四十九步,历经九九八十一难,终于,finally,at last 可以把同一个事件的多个时间段合并得到一个完整的时间段。但是不要高兴得太早了,还记得我们最开始的时候是 INPUTEVENTS_MV、CHARTEVENTS 和 PROCEDUREVENTS_MV 一共三张表格吗?现在我们刚刚把 INPUTEVENTS_MV 表格处理完,而已。我们在上一篇 Step 4 定下的步骤还记得吗?
有没有很惊喜?有没有很意外?我们做了这么就其实才做完 Step 4 的第 1 条哈哈哈哈。
好吧,乖乖继续按流程走吧。
Convert CHARTEVENTS into durations
(我已经连这应该是几级标题都搞不清楚了)
INPUTEVENTS_MV 处理好了,轮到下一个 CHARTEVENTS 。我们直接复用之前写好的代码就行了(一样的作为示例我们只看一个病人的):
|
|
(这一段代码的缩进我已经无力了…)
得到:
| * | num | starttime | endtime |
|---|---|---|---|
| 0 | 1 | Day 11, 23:43 | Day 12, 20:00 |
| 1 | 2 | Day 12, 22:00 | Day 13, 16:30 |
| 2 | 3 | Day 13, 18:15 | Day 13, 23:00 |
| 3 | 4 | Day 14, 15:27 | Day 16, 16:00 |
看看应该没问题,然后就可以去掉那个 AND icustay_id = 246866 来查询所有病人了 (猝不及防地又来了一段 Python,这是为了把查询 CHARTEVENTS 所有病人的查询语句记下来,后面就能直接用了。本来是应该用 R 的,但是我看了一下后面主要是作图。ggplot2 应该画同样的图没问题,但是我懒得查了):
|
|
Extract durations from PROCEDUREEVENTS_MV
PROCEDUREEVENTS_MV
里也有透析的记录。估计你们也忘了前面选的那些了。再列一次我们挑出来 itemid:
- 225802 – Dialysis - CRRT
- 225803 – Dialysis - CVVHD
- 225809 – Dialysis - CVVHDF
- 225955 – Dialysis - SCUF
提取这些数据就很直接了。每个 CRRT 的记录也只记录了一个 starttime 和 stoptime,也就不需要我们再去合并了。
|
|
得到:
| * | num | starttime | endtime |
|---|---|---|---|
| 0 | 1 | Day 11, 23:45 | Day 12, 20:30 |
| 1 | 2 | Day 12, 21:30 | Day 13, 23:15 |
| 2 | 3 | Day 14, 15:27 | Day 16, 16:02 |
可以看到上面的记录很勤:第 1 行与第 2 行这两条记录之间间隔了一个小时,这是实际中现实中 CRRT 治疗暂停了一个小时的反映。上面的代码没问题的话,现在又要去掉一个病人的限制条件了(和上面一样,这是后面 Python 需要用到的查询语句):
|
|
Roundup: data from INPUTEVENTS_MV, CHARTEVENTS, and PROCEDUREEVENTS_MV
好了,现在 3 个表都处理完了。综合一下 3 个结果,但首先我们得把三个结果都存储到一个变量里方便后面比较(这就要用到上一篇最后那个和本篇里上面两个存储在 Python 里的一共 3 个长长的查询语句了。由于我们已经存在 Python 变量了,所以现在只需要套壳 qurey() 就行了。
上面已经有了 query_chartevents 和 query_procedureevents ,干脆再贴一下 query_inputevents 的,免得回去翻:
|
|
而且这一次也不再是简简单单查询一下看一下数据,而是把结果存下来后面再比较分析)。一样的,先把环境搞起来,载入包:
|
|
简单设置并且连上数据库:
|
|
然后得到那三个数据:
|
|
进行下一步之前我们先看看得到的这三个数据到底长什么样子:
|
|
表格 ie:
| * | icustay_id | num | starttime | endtime | label |
|---|---|---|---|---|---|
| 0 | 205508 | 1 | 2101-07-09 18:10:00 | 2101-07-13 15:44:00 | Calcium |
| 1 | 280550 | 1 | 2101-08-02 21:20:00 | 2101-08-04 16:05:00 | Calcium |
| 2 | 280550 | 1 | 2101-08-03 08:56:00 | 2101-08-04 16:05:00 | KCl |
| 3 | 217315 | 1 | 2101-09-21 01:00:00 | 2101-09-21 09:00:00 | Calcium |
| 4 | 217315 | 2 | 2101-09-21 11:00:00 | 2101-09-27 11:00:00 | Calcium |
表格 ce:
|
|
| * | icustay_id | num | starttime | endtime |
|---|---|---|---|---|
| 0 | 200347 | 1 | 2116-06-10 15:00:00 | 2116-06-11 01:00:00 |
| 1 | 200347 | 2 | 2116-06-11 04:20:00 | 2116-06-11 18:00:00 |
| 2 | 200347 | 3 | 2116-06-11 19:00:00 | 2116-06-12 08:00:00 |
| 3 | 200347 | 4 | 2116-06-12 10:02:00 | 2116-06-13 10:26:00 |
| 4 | 200699 | 1 | 2105-04-30 00:19:00 | 2105-04-30 08:00:00 |
表格 pe:
|
|
| * | icustay_id | num | starttime | endtime |
|---|---|---|---|---|
| 0 | 200347 | 1 | 2116-06-10 15:00:00 | 2116-06-11 00:07:00 |
| 1 | 200347 | 2 | 2116-06-11 04:20:00 | 2116-06-12 07:27:00 |
| 2 | 200347 | 3 | 2116-06-12 10:00:00 | 2116-06-12 12:22:00 |
| 3 | 200347 | 4 | 2116-06-12 13:15:00 | 2116-06-13 10:29:00 |
| 4 | 200699 | 1 | 2105-04-30 00:19:00 | 2105-04-30 09:00:00 |
可以看到表格除了 ie 有一列 lable 用来表示使用的是钙还是钾之外,表格剩余 4 列都是 icustay_id、 num、starttime 和 endtime,其中 num 用来区分同一个人多次治疗。
Compare durations
现在呢,就把三个数据合起来。而且为了让合并起来的数据知道是来自于这三个表格中的哪个,我们还要加上一列 source。对于 ie 我们还得区分这是 KCl 还是 Ca:
|
|
然后合并后数据长这样:
| * | icustay_id | num | starttime | endtime | source |
|---|---|---|---|---|---|
| 0 | 205508 | 1 | 2101-07-09 18:10:00 | 2101-07-13 15:44:00 | inputevents_ca |
| 1 | 280550 | 1 | 2101-08-02 21:20:00 | 2101-08-04 16:05:00 | inputevents_ca |
| 2 | 280550 | 1 | 2101-08-03 08:56:00 | 2101-08-04 16:05:00 | inputevents_kcl |
| 3 | 217315 | 1 | 2101-09-21 01:00:00 | 2101-09-21 09:00:00 | inputevents_ca |
| 4 | 217315 | 2 | 2101-09-21 11:00:00 | 2101-09-27 11:00:00 | inputevents_ca |
然后单独拎出一个病人的数据,来看一下这个个不同来源的数据之间是否相互重叠:
|
|
得到:
| * | num | starttime | endtime | source |
|---|---|---|---|---|
| 0 | 1 | Day 09, 18:10 | Day 13, 15:44 | inputevents_ca |
| 136 | 1 | Day 09, 18:00 | Day 12, 15:15 | chartevents |
| 137 | 2 | Day 12, 16:02 | Day 12, 19:01 | chartevents |
| 138 | 3 | Day 12, 21:00 | Day 13, 14:03 | chartevents |
| 147 | 1 | Day 09, 18:00 | Day 13, 15:04 | procedureevents |
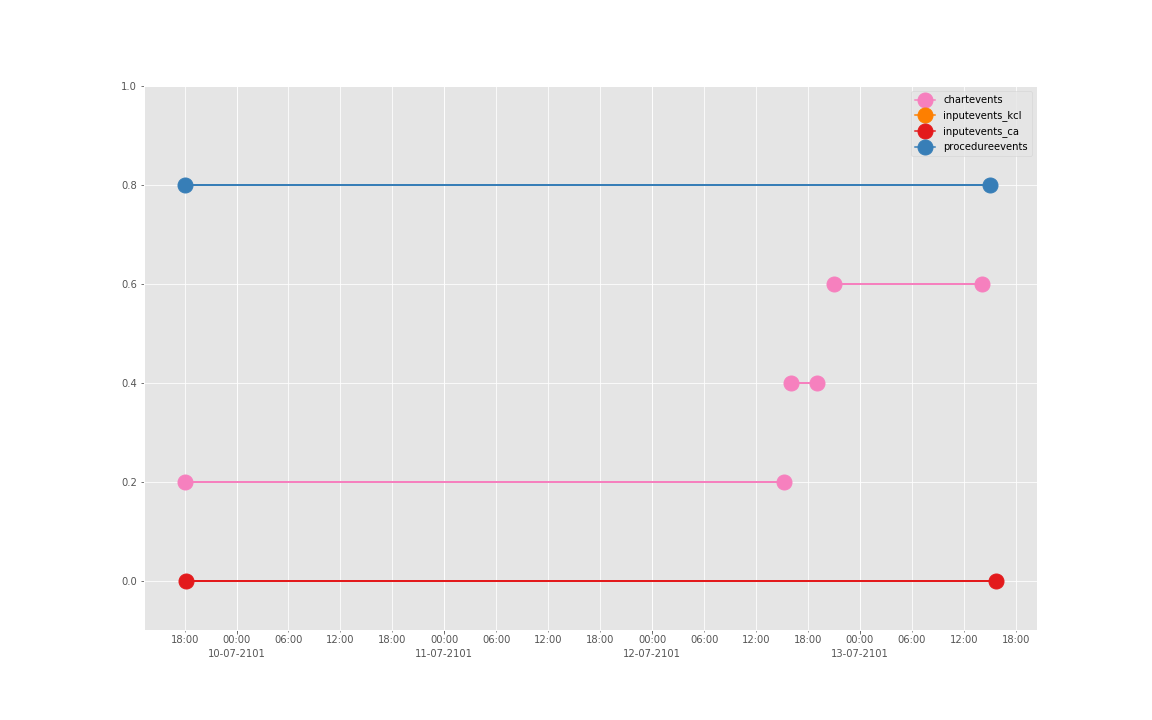
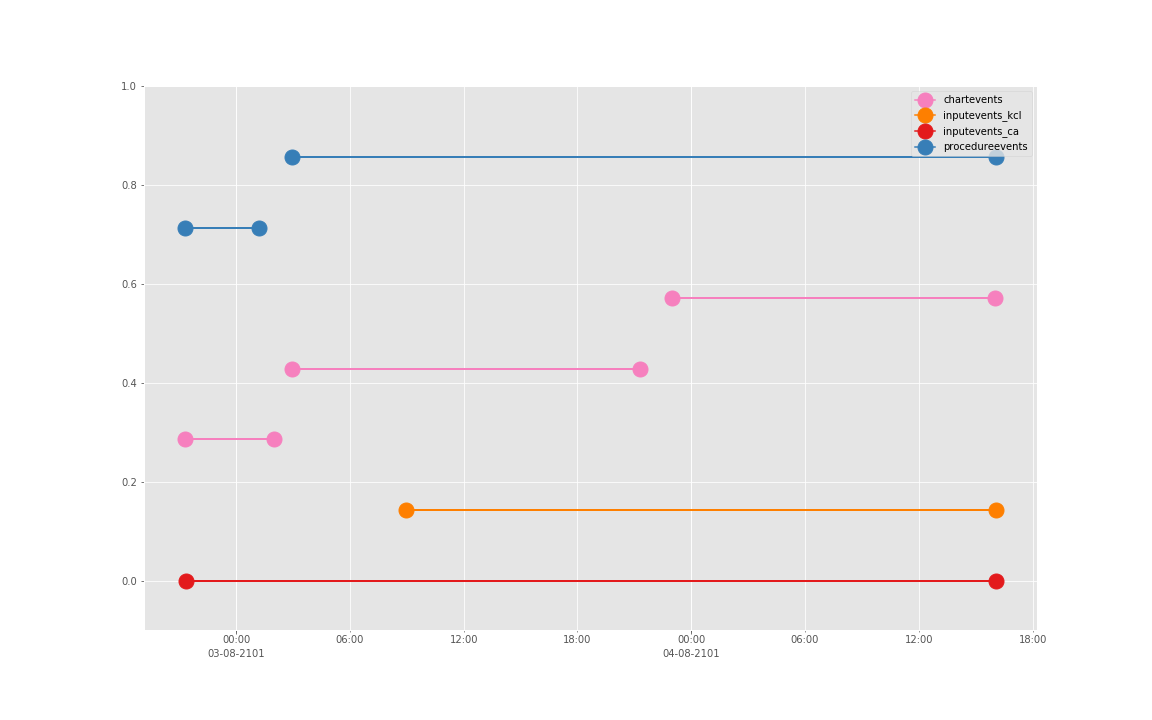
看表还不够直观,我们画图:
|
|
得到图:
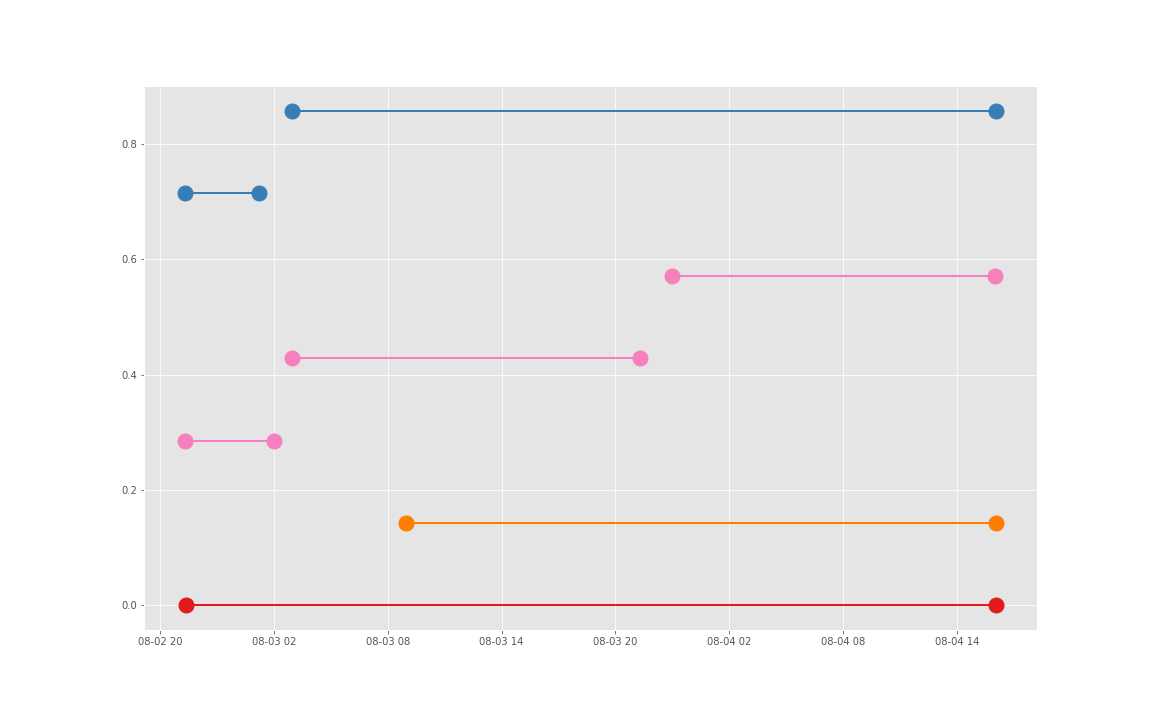
可以发现三个数据基本上对于起止时间记录相差不大,差别仅仅在于数据是否是分段记录的(治疗间的暂停如何记录和定义的问题)。
这是一个病人的数据。我们现在来直接看 10 个:
|
|
依次得到 10 个人的图:
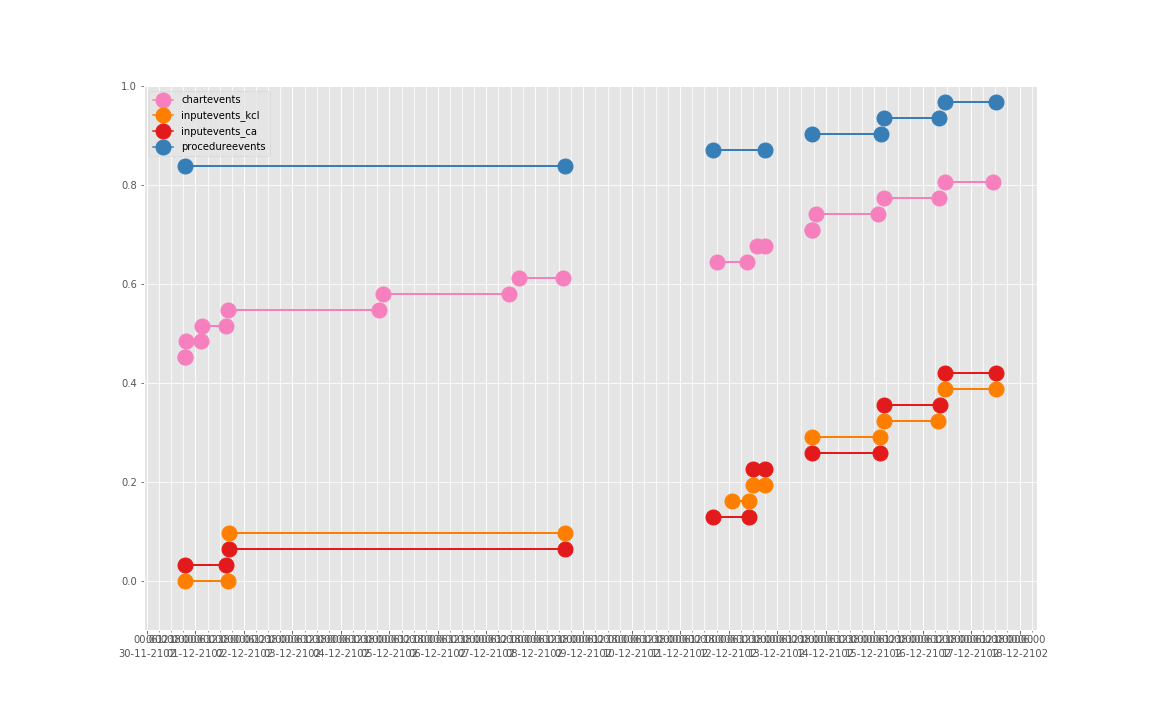
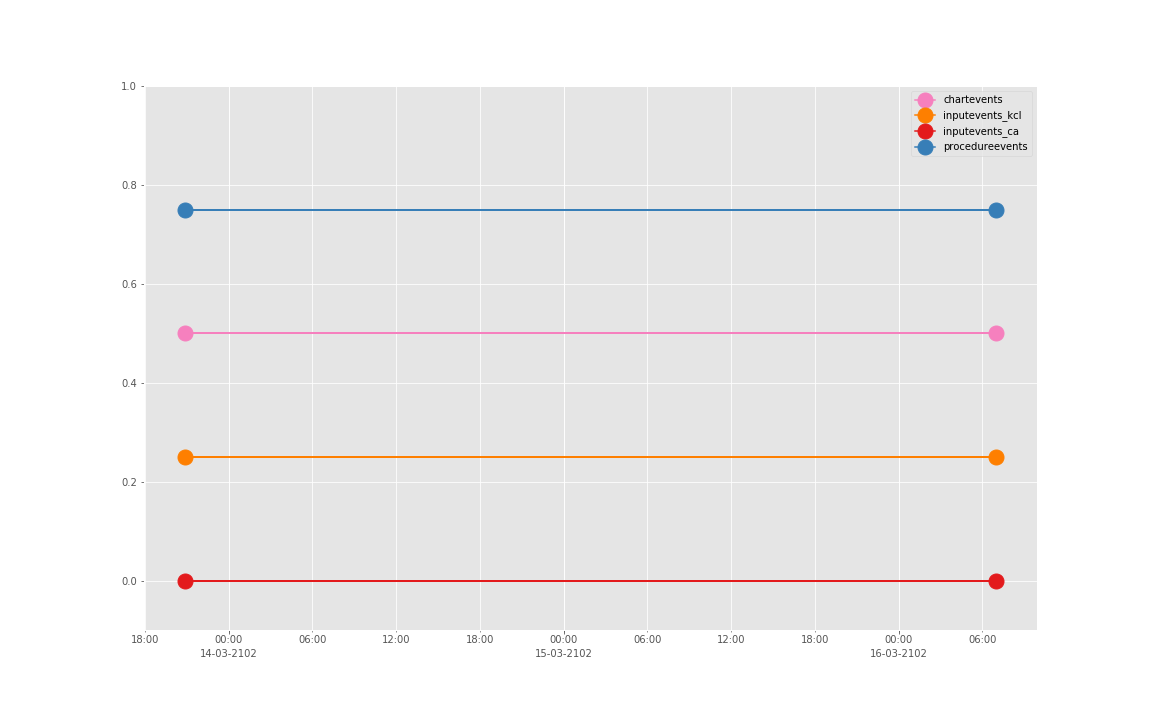
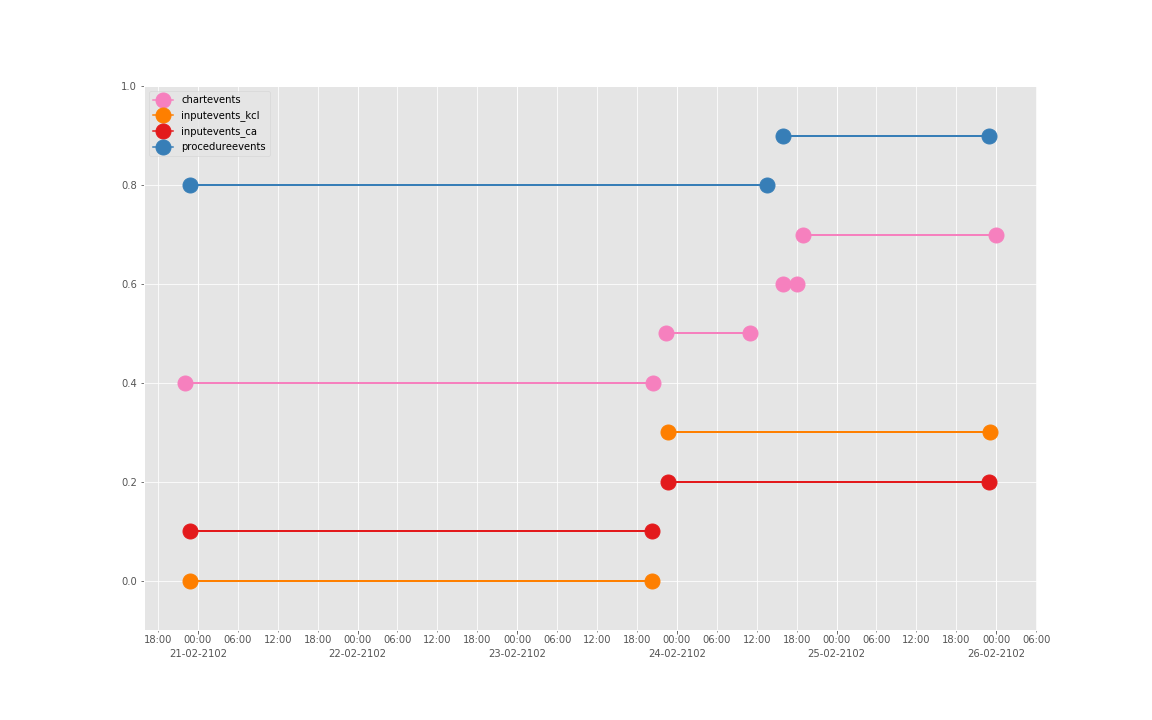
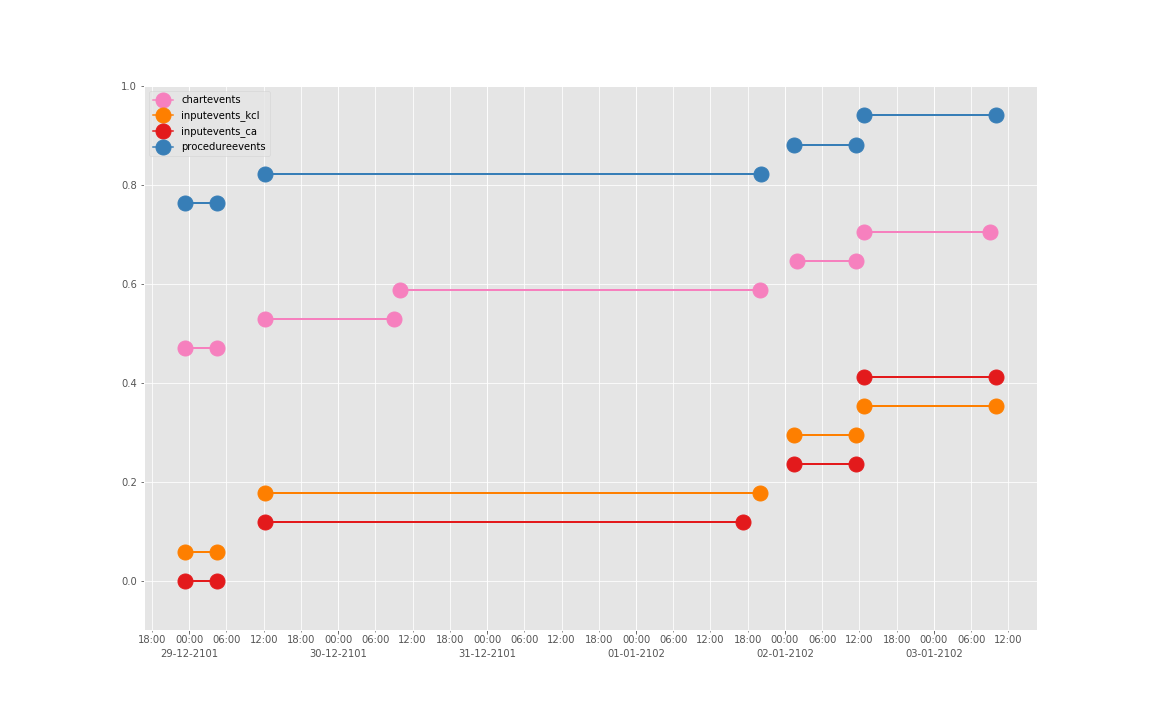
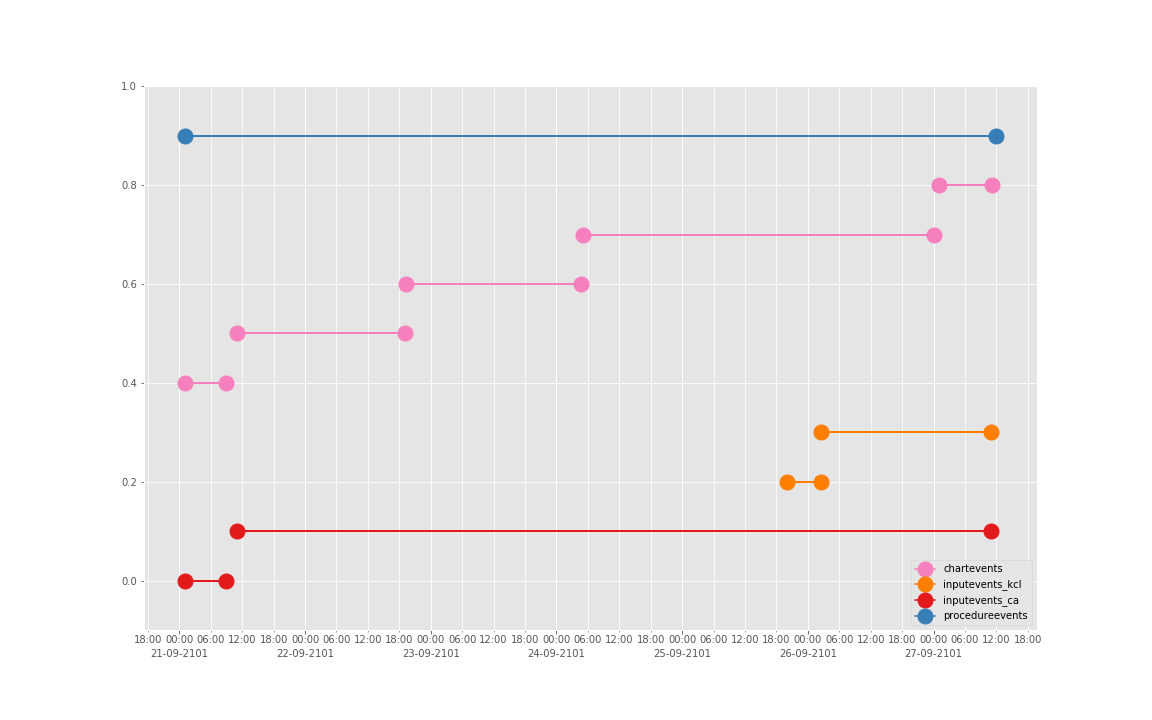
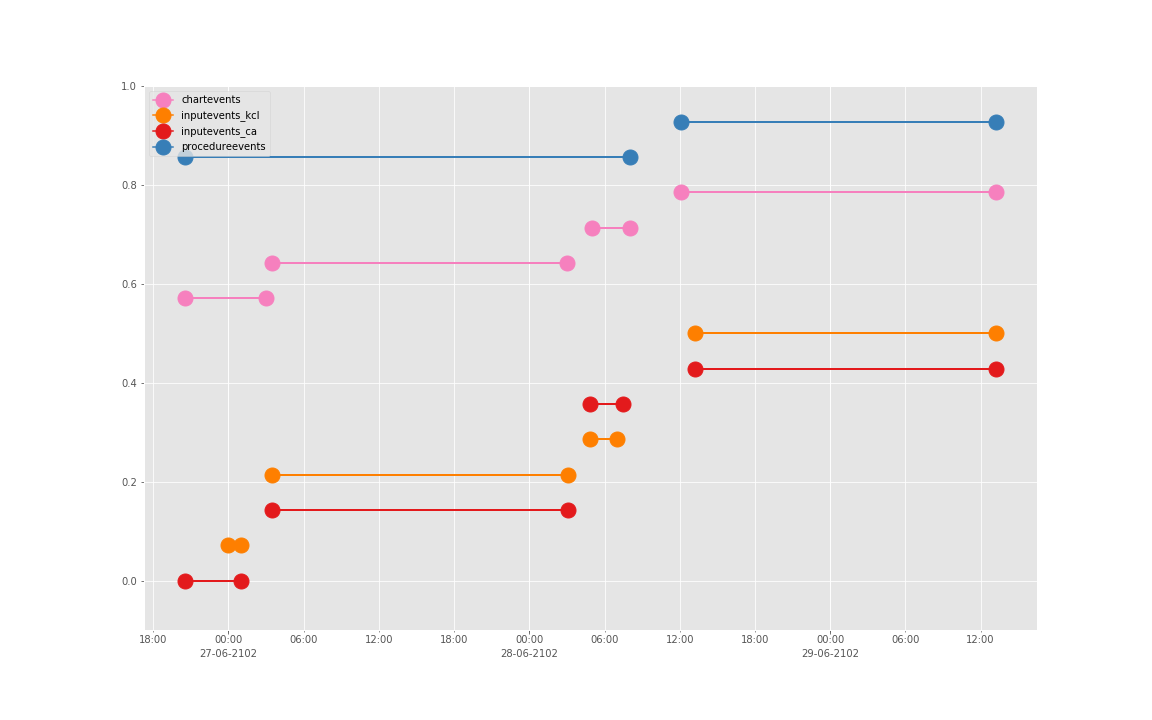
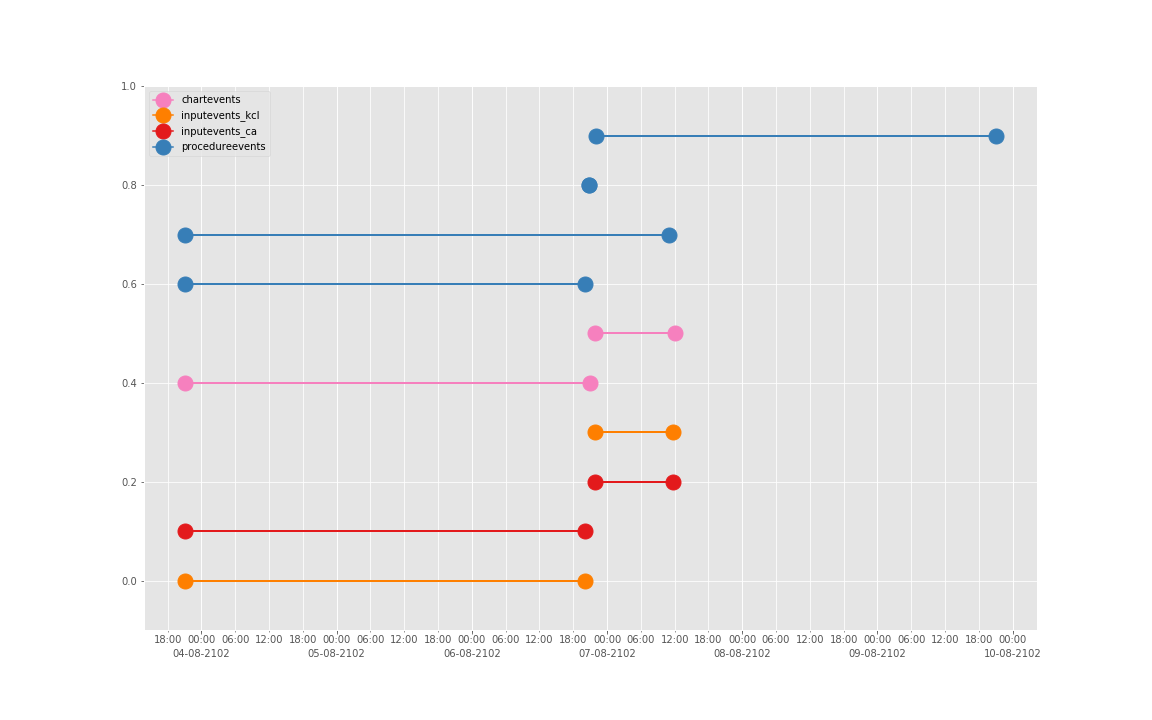
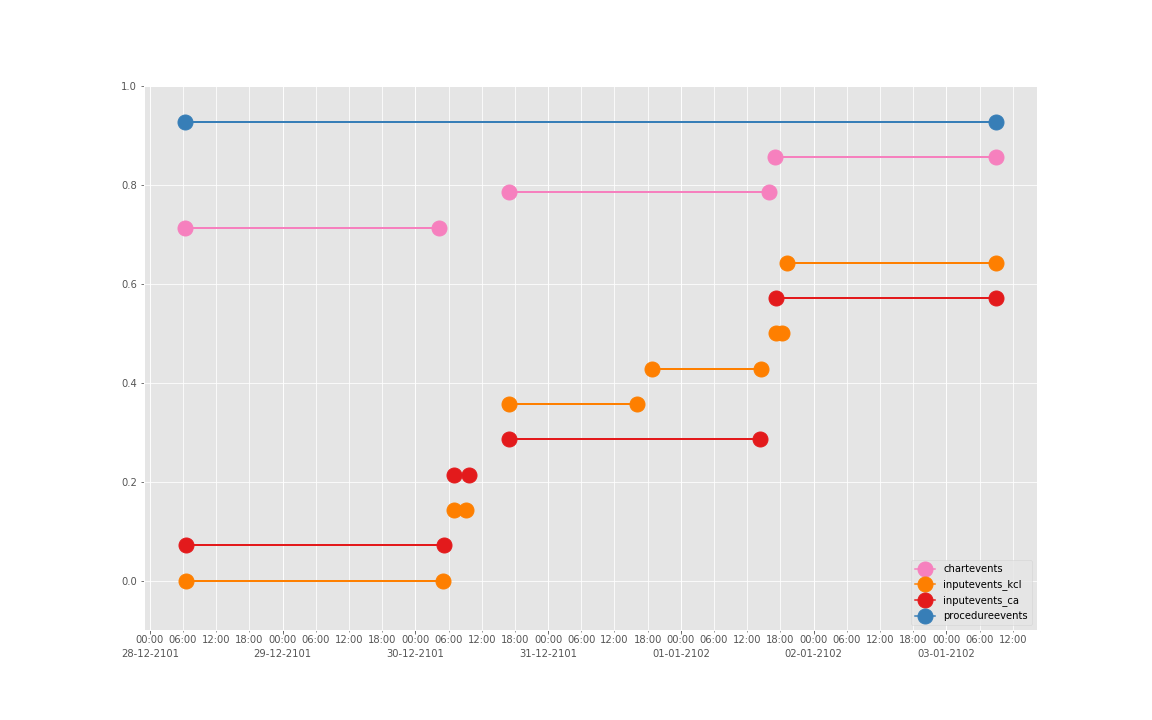
看了这些图,好像 INPUTEVENTS 和 PROCEDUREEVENTS_MV 里的数据对于 CHARTEVENTS 来说基本上是冗余的。而且,CHARTEVENTS 的记录似乎似乎更好地反映了 CRRT 治疗过程中因为输液管阻塞和治疗暂停等导致的记录中断。综合一下,我们其实对于反映 CRRT 的治疗时间来说,仅仅用 CHARTEVENTS 的数据就够了。concepts/durations/crrt-durations.sql 这里放的查询脚本包含了最终加入 CareVue 的 itemid(乖乖,我们到这里才算真的做完了一半,CareVue 的还没开始)。查找这些数据的方法和这个记事本讲的方法一样。
最难一根骨头终于啃完了。但是其实代码还不是特别熟悉,还要仔细看。然后后面再看哪一个再说。
发觉还是要好好学一下 Python 分析数据了,因为我发现好像 Python 查询 postgreSQL 好像速度要快很多,虽然我还是不算很喜欢 Jupyter-Notebook 这种工作方式。
文章作者 Jackie
上次更新 2019-01-11 (3e68be2)